TX Text Control .NET for Windows Forms Windows Forms GuideHowto: Add charting support to your applications
This chapter describes how to add charting functionality to TX Text Control.
The source code for this example is contained in the following directories:
Used TX Text Control controls:
Relevant API links:
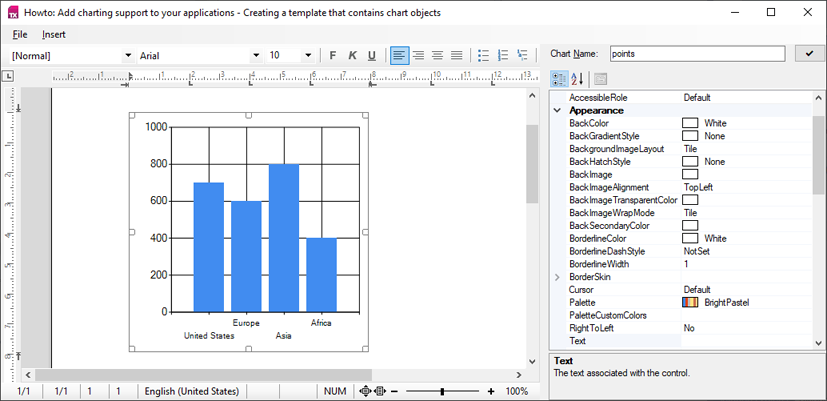
This first step shows how to insert chart objects into a document. Like TextFields, a ChartFrame has a unique name or ID that can be used to identify the chart object.
Choose Chart from the Insert main menu in order to add a chart object to your document. It is filled with default values to visualize formatting and style changes you may apply.

In the right panel, you can change the name of the ChartFrame that should match the DataTable name in step 2 of this sample series. Use the PropertyGrid to make changes to the chart object. These changes are maintained when saving the template.
The following code is used to insert the chart object:
private void Chart_Click(object sender, EventArgs e) {
// Create an object of type System.Windows.Forms.DataVisualization.Charting.Chart,
Chart chChart = new Chart();
// Add a series and a chart area.
chChart.Series.Add("series1");
chChart.ChartAreas.Add("area1");
// Set the data source.
chChart.DataSource = m_dtData;
// Set series members names for the X and Y values.
chChart.Series[0].XValueMember = "Country";
chChart.Series[0].YValueMembers = "Value";
// Data bind to the selected data source.
chChart.DataBind();
// Create new ChartFrame.
TXTextControl.DataVisualization.ChartFrame chartFrame = new TXTextControl.DataVisualization.ChartFrame(chChart);
chartFrame.Name = "points";
// Add it to the TextControl.
m_txTextControl.Charts.Add(chartFrame, -1);
}Private Sub Chart_Click(ByVal sender As Object, ByVal e As EventArgs) Handles m_tmiChart.Click
' Create an object of type System.Windows.Forms.DataVisualization.Charting.Chart,
Dim chChart As Chart = New Chart()
' Add a series and a chart area.
chChart.Series.Add("series1")
chChart.ChartAreas.Add("area1")
' Set the data source.
chChart.DataSource = m_dtData
' Set series members names for the X and Y values.
chChart.Series(0).XValueMember = "Country"
chChart.Series(0).YValueMembers = "Value"
' Data bind to the selected data source.
chChart.DataBind()
' Create new ChartFrame.
Dim chartFrame As TXTextControl.DataVisualization.ChartFrame = New TXTextControl.DataVisualization.ChartFrame(chChart)
chartFrame.Name = "points"
' Add it to the TextControl.
m_txTextControl.Charts.Add(chartFrame, -1)
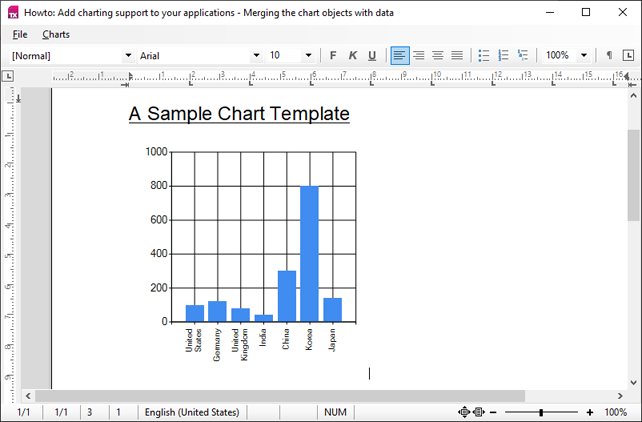
End SubThis second step shows how to merge the pre-defined chart objects with data from an XML data source. In the first step, a chart placeholder with a unique name has been added to the document. To merge the chart objects, the ChartCollection can be used to iterate through all charts in order to merge them with data.
Choose Load... from the File main menu and select the template created in step 1. Now, click Merge from the Charts main menu to start the merge process.

In the background, the XML data file is loaded into a DataSet. If the DataSet contains a DataTable with the name of the inserted ChartFrame, the new data is applied to the chart object:
// Create a new DataSet and load the XML data.
DataSet dsDataSet = new DataSet();
dsDataSet.ReadXml(@"Files\Data.xml");
foreach (TXTextControl.DataVisualization.ChartFrame chartFrame in colChartFrames) {
// Check whether the DataSet contains data
// related to the chart name.
if (!dsDataSet.Tables.Contains(chartFrame.Name)) {
continue;
}
// Get the Chart object from the chart frame.
Chart chChart = chartFrame.Chart as Chart;
// Set the x and y values to the first 2 columns of the DataTable.
chChart.Series[0].XValueMember = dsDataSet.Tables[chartFrame.Name].Columns[0].ColumnName;
chChart.Series[0].YValueMembers = dsDataSet.Tables[chartFrame.Name].Columns[1].ColumnName;
// Set the data to the chart.
chChart.DataSource = dsDataSet.Tables[chartFrame.Name];
// Data bind to the selected data source.
chChart.DataBind();
// Update the chartFrame to reflect the changes.
chartFrame.Refresh();
}' Create a new DataSet and load the XML data.
Dim dsDataSet As DataSet = New DataSet()
dsDataSet.ReadXml("Files\Data.xml")
For Each chartFrame As TXTextControl.DataVisualization.ChartFrame In colChartFrames
' Check whether the DataSet contains data
' related to the chart name.
If Not dsDataSet.Tables.Contains(chartFrame.Name) Then
Continue For
End If
' Get the Chart object from the chart frame.
Dim chChart As Chart = TryCast(chartFrame.Chart, Chart)
' Set the x and y values to the first 2 columns of the DataTable.
chChart.Series(0).XValueMember = dsDataSet.Tables(chartFrame.Name).Columns(0).ColumnName
chChart.Series(0).YValueMembers = dsDataSet.Tables(chartFrame.Name).Columns(1).ColumnName
' Set the data to the chart.
chChart.DataSource = dsDataSet.Tables(chartFrame.Name)
' Data bind to the selected data source.
chChart.DataBind()
' Update the chartFrame to reflect the changes.
chartFrame.Refresh()
Next